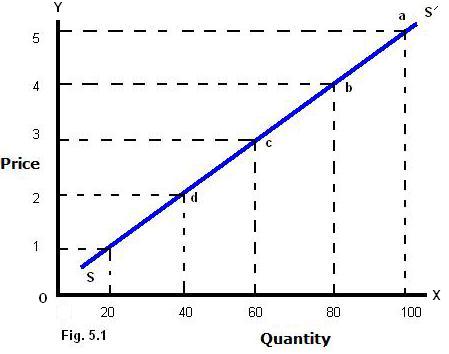
Supply Curve simply is defined as the relationship between product price and quantity. Let's take an example to understand clearly. Imagine yourself as a seller and supply here refers to the number of goods that are available to you. People who are willing to buy your goods refers to demand. Now when people buy your goods more result in the increase of supply hence the price of a product goes down and vice versa. Remember that supply sometimes increases because product cost less and this justifies only for limited period of time. What if small price fall leads to shrinkage in supply? This is what we term this situation as the elasticity of supply. In a real-life scenario, the elasticity of supply is not constant but it varies among supply curves.
Graphical representation of the Price elasticity supply is explained below:-
(a) Perfectly Inelastic Supply
Elasticity is equal to zero. Suppose being a seller your products price changed frequently due to any reasons but quantity supplied remained unaffected.

(b) Inelastic Supply
Elasticity is less than 1. Suppose the price of an item reduced to Rs.30 from its previous rate Rs.40 and supply reduces from 16% to 15% i.e. 1%. This supply is said to be inelastic.

(c) Unit Elastic Supply
Elasticity is equal to 1. When the quantity of supply changes with respect to changes in price.
(d) Elastic Supply
Elasticity is greater than 1. If big changes are observed in quantity supply when minor changes in price.

(e) Perfectly Elastic Supply
Elasticity equals infinity. Even a minute fall in the price of a product cause the supply immediately fall to zero.
No comments:
Post a Comment